
What the Point of Control Is
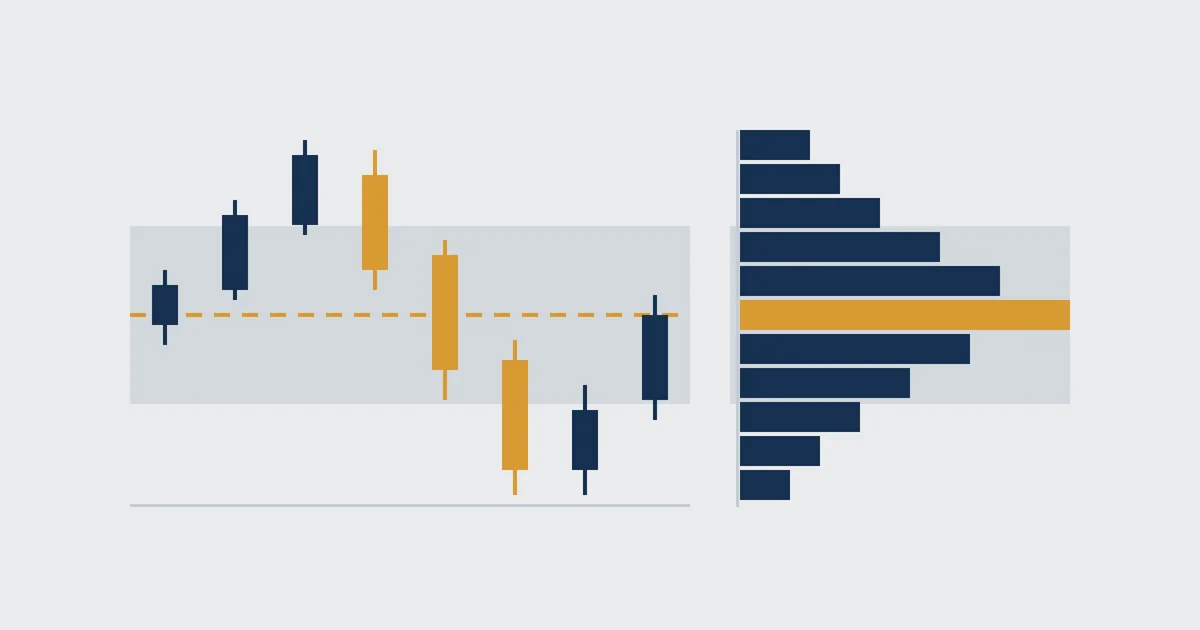
Here is the textbook picture everyone is taught. Price candles on the left, a sideways histogram of volume at each price on the right, and one bar longer than all the others.
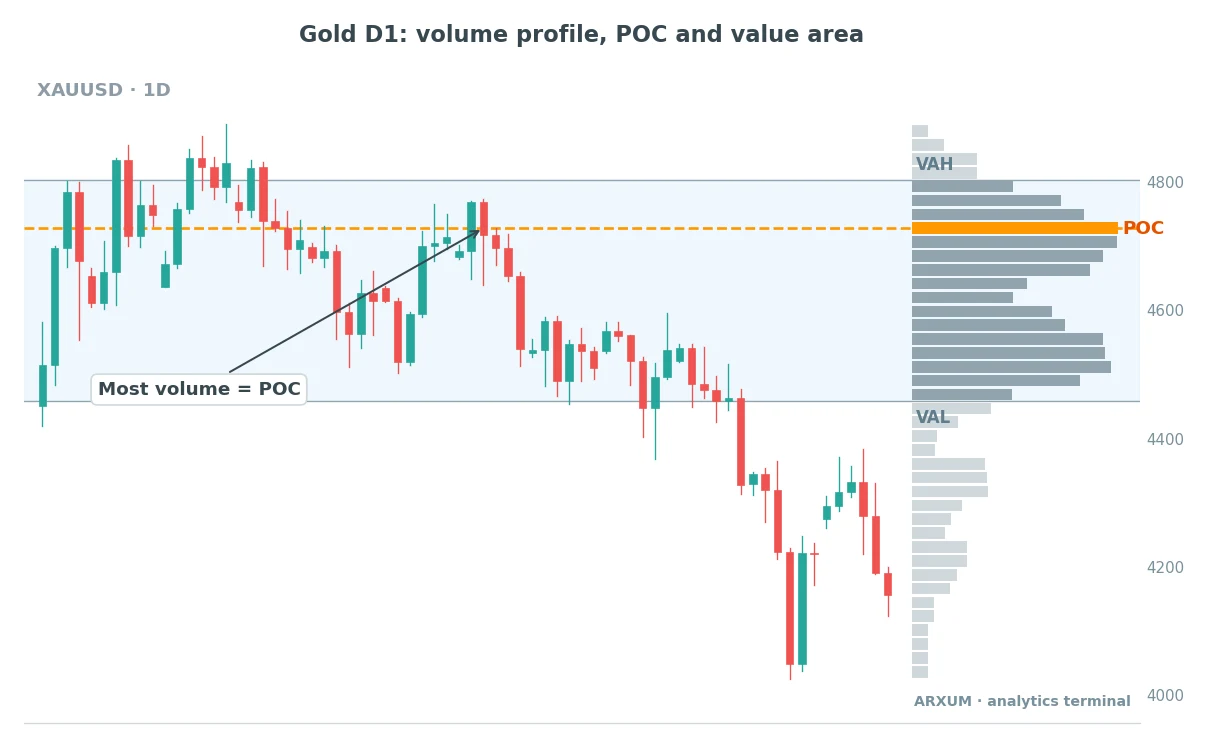
Read the chart from the right edge first. The profile tells you where the market did its business; the candles tell you how price moved through those prices.
- The widest bar is the POC. On this gold chart it sits near 4,730, the price where buyers and sellers traded the most over the window.
- The blue band is the value area. Price spent most of its time here and treated it as fair.
- The thin bars below the band show prices the market passed through fast. Little volume means little agreement.
- After weeks inside value, gold broke below VAL and dropped hard. Leaving value is how a quiet market turns into a trending one.
The idea comes from futures pits, where traders watched where the crowd did size. A level built by heavy two-way volume tends to matter again, because many positions were opened there.
The theory behind it is covered in our guide to auction market theory.
Point of control terms in one table
| Term | Short name | What it means |
|---|---|---|
| Point of control | POC | Busiest single price |
| Value area | VA | Band with ~70% of volume |
| Value area high | VAH | Top of the value area |
| Value area low | VAL | Bottom of the value area |
| High volume node | HVN | A thick cluster of bars |
| Low volume node | LVN | A thin gap in the profile |
| Developing POC | dPOC | POC of a session still open |
| Naked POC | nPOC | Old POC price never revisited |
A few of these need one more line each.
- A high volume node is a broad lump of long bars. The POC is the peak of the biggest lump, but a profile can have two or three nodes.
- A low volume node is a valley between lumps. Price tends to move through it quickly, since nobody wanted to trade there before.
- A developing POC moves during the session as volume builds. It only settles when the session closes.
- A naked POC belongs to an earlier session, and price has not traded back to it since. Many day traders keep these on the chart as targets.
How the POC Is Calculated
You will never compute this by hand, but knowing the steps tells you why two charts can show different POCs.
- Pick a window: one session, one week, a swing from high to low, or whatever is on screen.
- Split the price range of that window into equal rows. TradingView calls this the row size.
- Add up the volume traded inside each row. A candle spread across several rows has its volume shared between them.
- The row with the most volume is the POC.
- Starting from the POC, add the busier neighbouring row, up or down, until the total reaches about 70% of the window’s volume. That band is the value area.
Two settings change the answer, so keep them fixed once you choose.
- Window: a POC is always the POC of something. Change the window and the POC moves.
- Row size: coarse rows give a smooth profile and a fat POC zone. Fine rows give a sharp but jumpy one.
Which profile type gives which POC
| Profile type | Window | Best for |
|---|---|---|
| Session | Each trading day | Intraday, M15-H1 |
| Fixed range | Bars you select | One swing or range |
| Visible range | Whatever is on screen | Quick overview |
| Composite | Weeks or months | Swing, H4-D1 |
| Anchored | From an event you pick | News or breakout bar |
The three charts in this guide use a fixed range: the last stretch of bars ending at the right edge. That is the simplest way to see the POC behave.
Three Ways to Trade the Point of Control
Most POC trading comes down to three ideas. Each one reads the same level, but asks a different question of it.
| Method | Question it asks | Market type |
|---|---|---|
| 1. POC magnet | Will price drift back? | Range, balance |
| 2. Accept or reject | Does the level hold? | Range edges, tests |
| 3. Intraday reference | Where is today's value? | Day trading |
1. The POC Magnet: Price Returns to Fair Value
When a market is balanced, price wanders away from the POC and then comes back. The busiest price acts as the market’s centre of gravity.
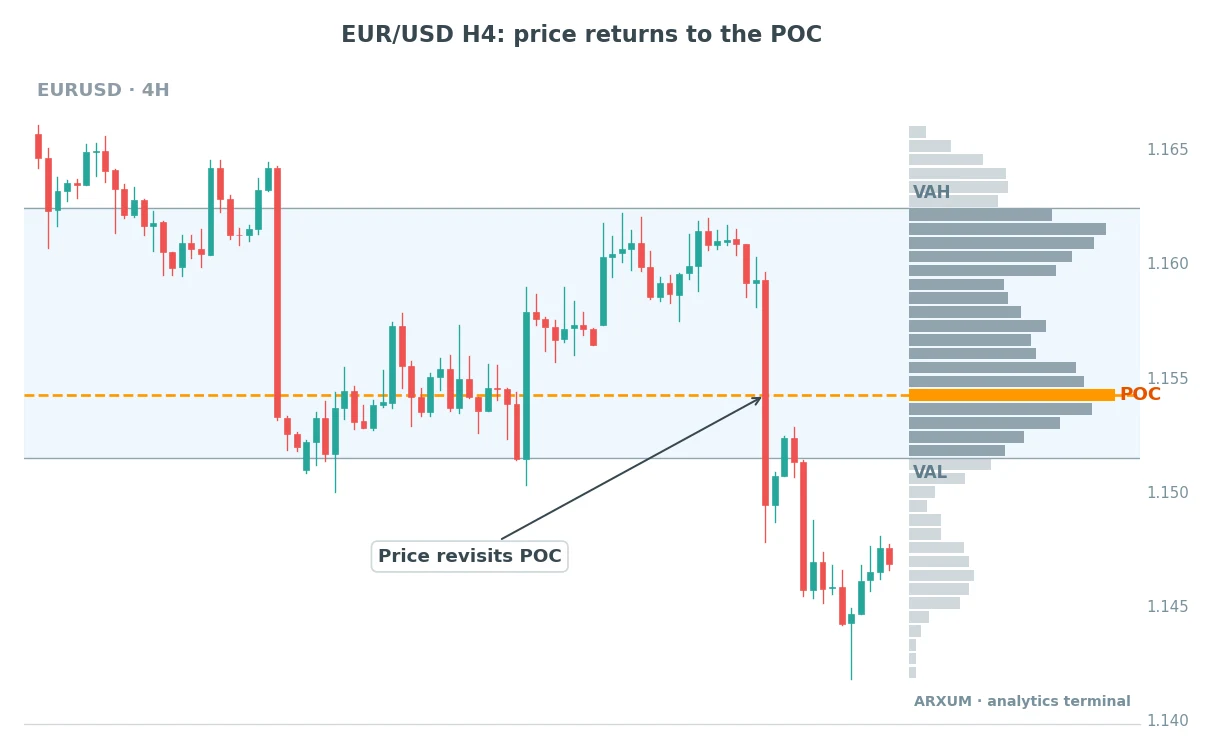
What happened on EUR/USD, left to right:
- Price spent days rotating around 1.154, building the thickest part of the profile. That is where the POC came from.
- A rally pushed it up to the top of value, around 1.160 to 1.162. The thin bars above VAH show buyers could not build volume there.
- Price fell back to the POC, the magnet pull in action.
- It did not stop there. The drop sliced through the POC and out below VAL, then traded down to about 1.144 before bouncing.
That last point is the honest part. The magnet tells you where price is likely to visit, not where it will turn.
| Role | How to use it | Best read |
|---|---|---|
| Target | Take profit near POC | H4 EUR/USD, GBP/USD |
| Regime read | Price inside value = range | H4, D1 |
| Filter | Skip trades far from value | Any TF |
| Exit cue | Close on POC slice-through | H1 inside an H4 plan |
Rule of thumb: use the POC as a target from the edges of value, not as an entry in the middle of it.
2. Acceptance or Rejection at the POC
This method opens with a question rather than a chart: when price reaches the POC, does it stay or bounce away? The answer tells you whether the old value still holds.
| What price does | What it means | Typical next move |
|---|---|---|
| Quick wick, close away | Rejection | Move back the other way |
| Several closes at POC | Acceptance | More rotation around it |
| Closes through, no return | Value is shifting | Run toward VAH or VAL |
| Holds outside value | New value forming | Trend leg, new profile |
Signs of rejection you can see on the candles:
- A long wick that pokes through the POC and closes back on the original side.
- A strong candle away from the POC straight after the touch.
- On Bitcoin, a burst of real exchange volume on the reversal candle.
Signs of acceptance:
- Two or three candles closing near the POC with small bodies.
- Price crossing the POC back and forth, which is normal rotation.
- On H4 or D1, a full session that opens and closes on the same side, beyond the POC.
The gold chart at the top shows the bigger version of this. Gold accepted prices inside the value area for weeks, then closed below VAL and kept going.
Once a market rejects its old value, that old POC often turns into resistance on the way back up.
| Role | How to use it | Best read |
|---|---|---|
| Entry trigger | Rejection candle at POC | H1, H4 gold, EUR/USD |
| Confirmation | Close beyond, then retest | H4, D1 |
| Trend read | Close outside value | D1 gold, oil |
| Stop placement | Beyond the POC zone | Any TF |
Rule of thumb: one touch is information, not a trade. Wait for the candle that shows which way the market chose.
The level reading here is the same skill as classic support and resistance. The difference is the reason the line exists: volume, not a previous swing point.
3. The Intraday POC Reference
Day traders treat the POC like a moving centre line for the current session. Price above it leans bullish, price below leans bearish, and the POC itself is where the chop happens.
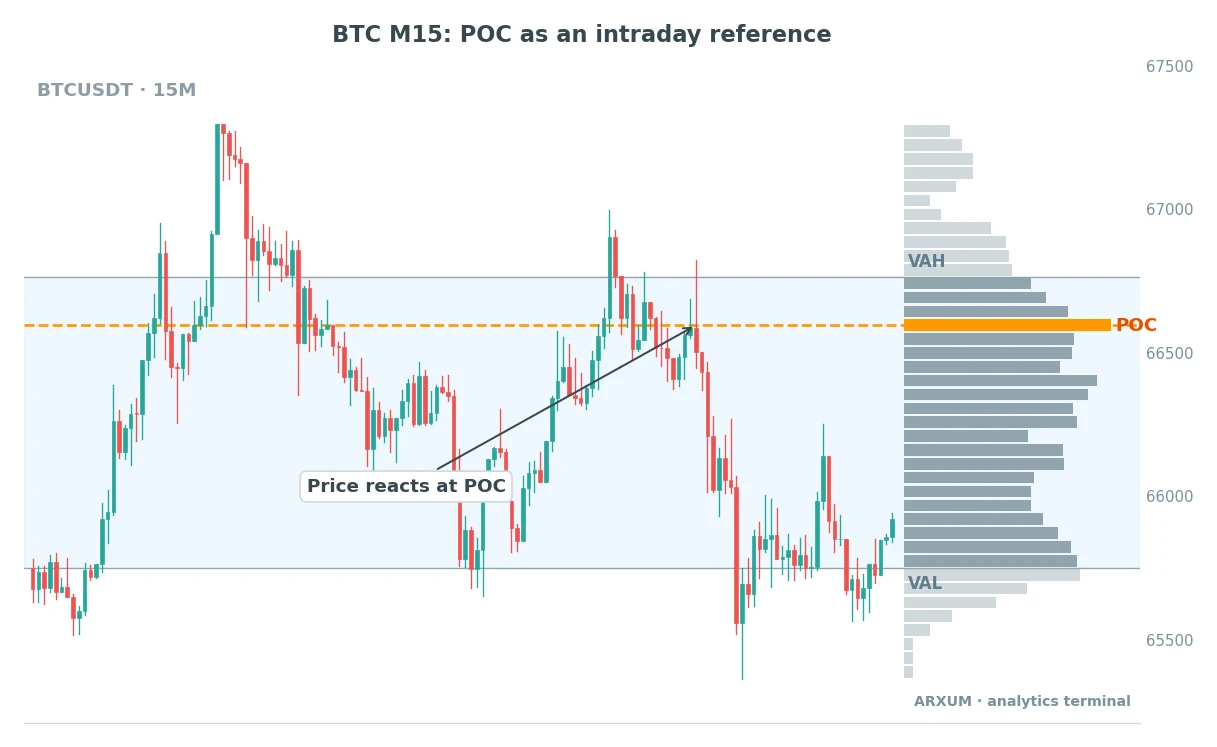
How the Bitcoin session played out:
- A spike above 67,000 early in the window traded little volume. The light bars up there show it.
- Price settled into a range, and most of the trading happened between roughly 65,800 and 66,700.
- After a dip toward VAL and a rally back, price tagged the POC and stalled. A long upper wick there shows sellers waiting at the busiest price.
- The next leg fell to VAL and briefly below it. Then it climbed back inside value.
Crypto trades around the clock, so there is no session open in the Forex sense. Many traders use the UTC day, or simply a fixed number of recent bars, as the window.
| Role | How to use it | Best read |
|---|---|---|
| Bias | Above dPOC = lean long | M15, H1 |
| Entry trigger | Reclaim or loss of POC | M5 (5-minute) to M15 BTC, gold |
| Target | Prior day's naked POC | M15, H1 |
| Filter | No trades near POC chop | M15 |
| Exit cue | Trail stop past VAH/VAL | H1 |
Rule of thumb: the session POC tells you where the fight is today. Trade away from it, not on it.
A common pairing is the POC with the session VWAP. VWAP weights price by volume over time, while the POC picks the busiest single price.
When both sit close together, that zone tends to draw a lot of attention.
Point of Control Trading Across Markets
The POC ports well because every liquid market has a busiest price. What changes is the quality of the volume feeding it.
| Instrument | Volume source | Best timeframes |
|---|---|---|
| XAU/USD (gold) | Broker tick volume | H4, D1 |
| EUR/USD | Broker tick volume | H1, H4 |
| GBP/USD | Broker tick volume | H1, H4 |
| XAG/USD (silver) | Broker tick volume | H4, D1 |
| WTI oil | Tick, or futures volume | H1, H4 |
| BTC/USDT | Real exchange volume | M15, H1, H4 |
What that means in practice:
- Spot Forex has no central exchange. The profile is built from tick volume, a count of price changes per candle. It tracks real activity reasonably well, but it is your broker’s feed, not the whole market.
- Two brokers can show slightly different POCs on the same pair. Treat the POC as a zone a few pips wide, not one exact tick.
- Bitcoin on a major exchange gives real traded volume, so the profile is a cleaner read. Profiles still differ between exchanges.
- Gold and oil CFDs (contracts for difference, which track the price without owning the asset) follow futures closely. See the CFD trading guide. Some traders check the futures profile for a second opinion.
- Silver moves fast through thin areas. Its low volume nodes can produce sharp jumps between nodes.
Which timeframe for which job
| Timeframe | Profile window | Main use |
|---|---|---|
| M15 | Session or UTC day | Intraday bias, scalps |
| H1 | Session or week | Day trades, timing |
| H4 | One to three weeks | Swing targets |
| D1 | One to four months | Big-picture value |
- The higher the timeframe, the more volume stands behind the POC, and the more traders are likely to respect it.
- On M15 a POC can form inside a single news spike. Check it against the H1 or H4 profile before leaning on it.
- A clean approach for most readers: mark the D1 and H4 POCs as the map, then use H1 or M15 only for timing.
For scalping on the lowest timeframes, our scalping guide covers the speed and cost side that a POC level alone does not solve.
How to Add the POC on TradingView and MT5
Search the exact names below, because TradingView has many community look-alikes that calculate differently.
| Platform | Indicator name | Key setting |
|---|---|---|
| TradingView | Fixed Range Volume Profile | Value Area Volume 70 |
| TradingView | Session Volume Profile | Value Area Volume 70 |
| TradingView | Visible Range Volume Profile | Row size: auto |
| MT4 / MT5 | No built-in profile | Market or community tool |
Setup notes:
- On TradingView, open the Indicators button and type “Volume Profile”. The built-in versions show the POC line by default. Availability can depend on your plan.
- For a fixed range, click the first and last candle of the swing you want measured. That is how the three charts in this guide were framed.
- Keep “Value Area Volume” at 70. It is the industry default, and changing it moves VAH and VAL.
- Pick one row size and leave it. Switching between settings moves the POC and invites second-guessing.
- MetaTrader 4 and 5 do not ship a volume profile. You need a third-party indicator from the MQL5 market or a community script, so check how it computes volume before you trust it.
Using the POC With Risk Rules
A POC tells you where to look. Position size and the stop decide whether one bad read hurts or barely registers.
A worked example on EUR/USD
Say you have a $1,000 account and risk 2% per trade, so $20. Price on EUR/USD rejects the POC, and the stop goes 25 pips beyond the POC zone.
- Risk budget: $1,000 × 2% = $20.
- Risk per micro lot: 25 pips × $0.10 per pip = $2.50.
- Position size: $20 ÷ $2.50 = 8 micro lots, which you enter as 0.08 lots.
That position controls about 8,000 euros, roughly $9,200 at current prices. On a $1,000 account that is about 1:9 effective leverage.
Broker leverage of 1:100 or more only frees up margin to open the trade; your real risk is still the $20 set by the stop.
The same idea on gold
Gold moves in bigger steps, which changes the math for a small account. One micro lot is 1 ounce, so every $1 move costs $1 per micro lot.
- Stop beyond the gold POC zone: $15 away from entry.
- Risk per micro lot: $15 × 1 oz = $15.
- Position size: $20 ÷ $15 = 1.33, rounded down to 1 micro lot (0.01 lots).
That rounds your real risk to $15, or 1.5% of the account, slightly under the 2% rule.
If the POC zone forces a stop wider than $20, the trade does not fit a $1,000 account at all. Skip it, or use the EUR/USD version instead.
Placing the order
- Rejection play: wait for the rejection candle to close, then enter at market or with a limit order (an order that fills only at your price or better) back toward the POC.
- Stop-loss field: a few pips or dollars beyond the far side of the POC zone, not on the POC line itself.
- Take-profit field: the opposite edge of value (VAH or VAL) or a naked POC, whichever comes first.
- Check the distance with a risk/reward ratio before clicking. If the target is closer than the stop, pass.
Two habits keep this from going wrong:
- Losing streaks happen even with a good read. Three to six losses in a row is a signal to pause and check whether the market has switched from range to trend.
- Do not chase a move that has already left value, and do not double up after a loss to win it back. The POC will still be there next session.
More on where to put stops lives in our stop-loss guide.
Common Point of Control Mistakes
- Treating the POC as a wall. It is a zone of interest. The EUR/USD chart shows price returning to it, then cutting straight through.
- Trading the POC in the middle of the chop. Price crosses it again and again during balance, and each cross looks like a signal.
- Changing the profile window until the POC lands where you hoped. Pick the window by a rule, such as “this session” or “this swing”.
- Ignoring the timeframe. An M15 POC carries far less weight than a D1 one.
- Using the POC alone in a strong trend. A trending market builds new value and leaves old POCs behind without looking back.
- Forgetting that Forex volume is tick volume. A POC two pips different from a friend’s chart is normal.
- Putting the stop exactly on the POC. That is where the most orders crowd, so wicks through it are common.
Which POC Method to Use When
| Market condition | Method | Timeframe |
|---|---|---|
| Sideways, inside value | POC magnet | H4 |
| Price testing the POC | Accept or reject | H1, H4 |
| Price broke out of value | Old POC as retest | H4, D1 |
| Busy intraday session | Intraday reference | M15, H1 |
| Strong one-way trend | Stand aside or use VWAP | Any |
A few notes on that table:
- In a strong trend the POC loses most of its pull. An anchored VWAP from the swing start often tracks a trend better.
- After a breakout, the old POC often becomes the retest level. That is acceptance-or-rejection again, from the other side.
- If two methods disagree, the higher timeframe usually wins.
What Works With the POC
- Map first, trade second. Mark the D1 and H4 POCs and value areas before the session. They tell you where the market cares.
- Trade from the edges toward the POC. Entries near VAH or VAL with the POC as a target give the cleanest risk-to-reward.
- Let the candle decide at the POC. A rejection wick or a close beyond it is the trigger. The touch alone is not.
Point of Control Glossary
- POC: the price with the most traded volume in the chosen window.
- Volume profile: a sideways histogram showing volume at each price instead of each time period.
- Value area: the band around the POC holding about 70% of the volume.
- VAH / VAL: the top and bottom of the value area.
- HVN / LVN: high and low volume nodes, the thick lumps and thin gaps in the profile.
- Developing POC: the POC of a session still in progress. It can move until the close.
- Naked POC: an older POC that price has not returned to yet.
- Tick volume: Forex’s count of price changes per candle, a stand-in for traded volume.
- Balance: a market rotating inside value. Imbalance: a market trending away from it.
- M15 / H1 / H4 / D1: chart timeframes, where each candle is 15 minutes, 1 hour, 4 hours or 1 day.
FAQ
What is the point of control, in plain terms?
It is the single price where the most volume traded during a chosen period, such as one session or one swing. On a volume profile it is the longest horizontal bar. Traders read it as the price the market agreed was fair value.
Is the POC support or resistance?
It can be either. Price above the POC often finds support there on a pullback, and price below it often meets resistance on a rally. It is a zone of interest, not a guaranteed turning point, so wait for a rejection candle or a close beyond it before acting.
Does point of control trading actually work?
It works best as a map rather than a signal. In balanced, sideways markets price tends to return to the POC, which makes it a useful target and reference. In strong trends price can slice through it and leave it behind. Most traders combine it with price action at the level and with the value area edges.
What is the best timeframe for the POC?
H4 and D1 for swing levels, M15 and H1 for intraday work. Higher timeframes have more volume behind the POC, so the level carries more weight. A common approach is to mark the daily and 4-hour POCs as the map, then time entries on the 1-hour or 15-minute chart.
What settings should I use for the volume profile?
Keep Value Area Volume at 70, the standard. Use the automatic row size to start, then keep it fixed. Choose the window by a rule, such as this session or this swing.
What is a naked POC?
A naked POC is the point of control of an earlier session that price has not traded back to since. Many day traders keep naked POCs on the chart as potential targets, because price often revisits these old busy prices.
What is the difference between the POC and VWAP?
VWAP is the average price weighted by volume over time, so it is a moving line. The POC is the single busiest price in a window, a horizontal level. They often sit close together in a quiet session and drift apart in a trend.
Can I use the POC on Forex and crypto?
Yes. On spot Forex the profile is built from tick volume, a count of price changes, so treat the POC as a zone a few pips wide. Bitcoin on a major exchange gives real traded volume and a cleaner profile. Gold, silver and oil also work well on H4 and D1.
How much money do I need to trade POC setups?
A few hundred dollars is enough on Forex using micro lots. On a $1,000 account risking 2% with a 25-pip stop on EUR/USD, the size is 8 micro lots. Gold needs a tighter stop to fit a small account.
What do the key point of control terms mean?
POC: the busiest price. Value area: the band holding about 70% of volume. VAH and VAL: its top and bottom. HVN and LVN: thick and thin parts of the profile. Developing POC: the current session's POC. Naked POC: an old POC price has not revisited. Tick volume: Forex's stand-in for traded volume.
Real-time trade setups with entry, stop loss and take profit. Daily market analysis. No subscription, no complicated theory.
🌍 Our recommended brokers


Reader Reviews
Be the first to review this — tell other traders what actually helped, or where it fell short.
Leave a Review

Forex Analyst & Senior Trader
Former FX desk trader with 8 years in institutional forex. Works in multi-timeframe analysis and order flow, turning desk experience into systematic, testable rules across forex and metals.