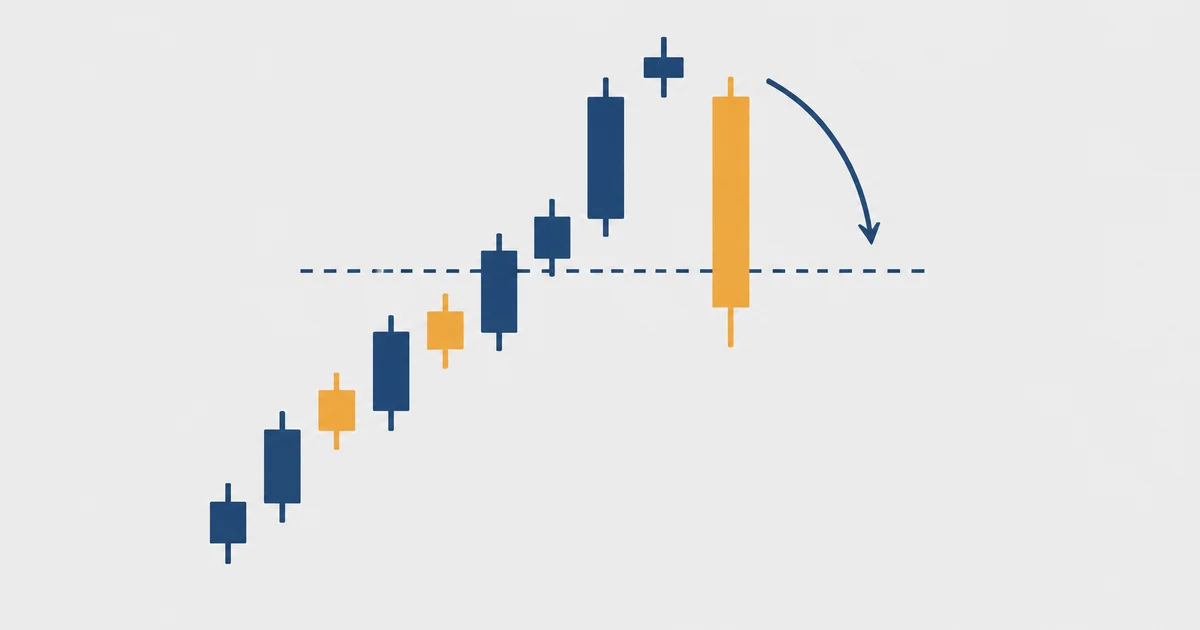

What the evening star candlestick looks like
Three candles, read left to right, after a clear move up. Here is the textbook shape before any real chart.
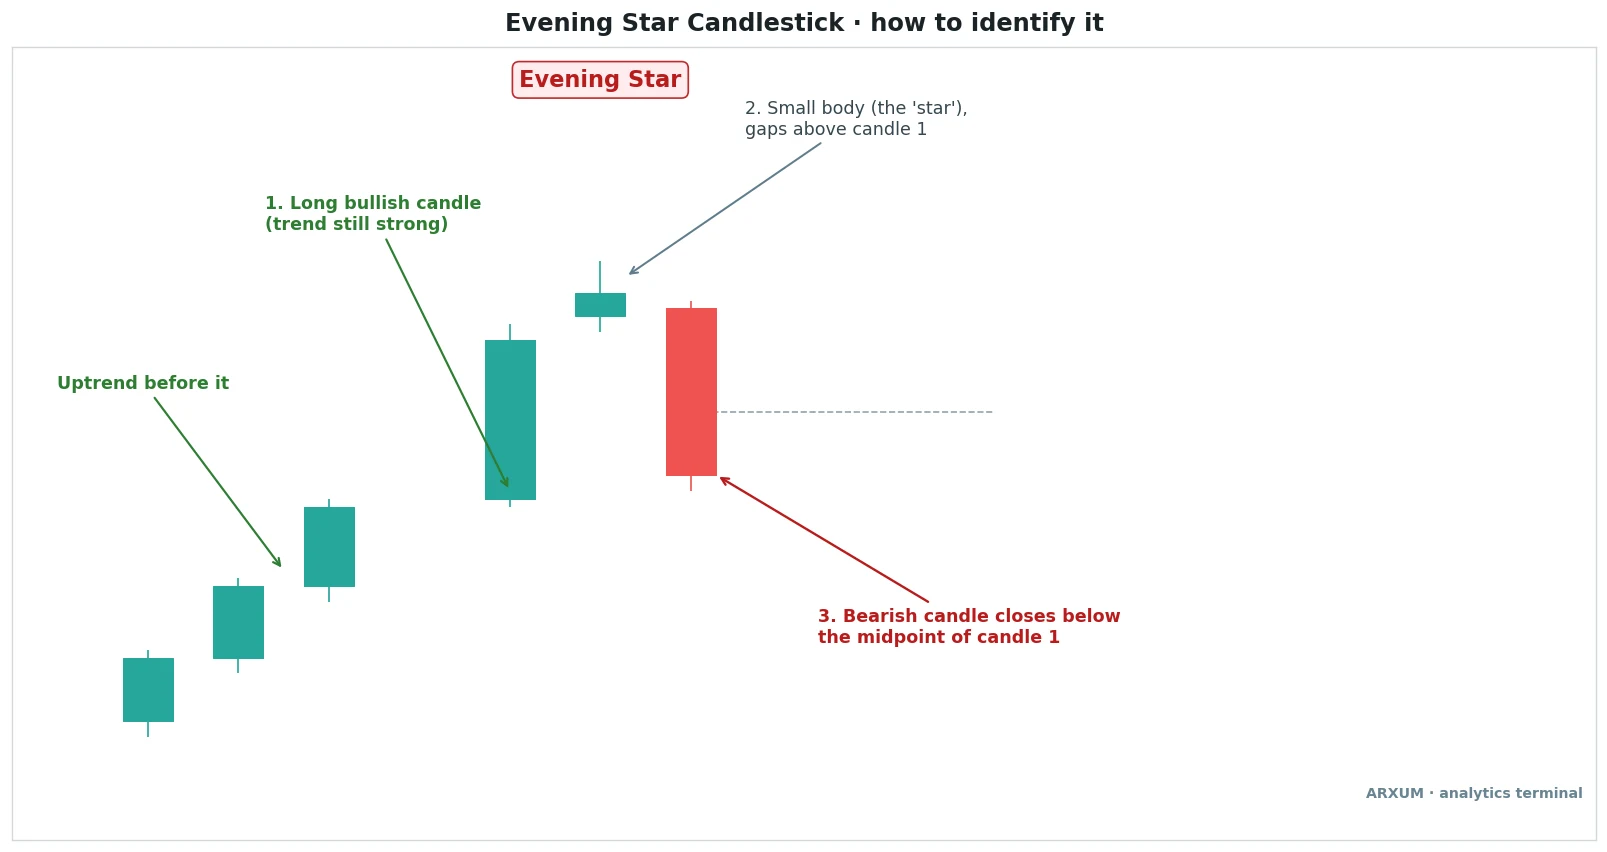
The picture carries the whole pattern. Point by point:
- Uptrend before it. Without a rally there is nothing to reverse, and three random candles mean nothing.
- Candle 1, the push. A long green body. Buyers are still fully in charge here.
- Candle 2, the star. A small body, either colour, sitting at or above candle 1’s close. On the chart it opens with a small gap above candle 1.
- Candle 3, the reversal. A red body that opens near the star and closes below candle 1’s midpoint, the dashed line.
- The midpoint test. A close below that line means sellers erased more than half of the push. That is the line between a dip and a turn.
| Part | Rule | Why it matters |
|---|---|---|
| Location | After a clear rally | Gives it a trend to end |
| Candle 1 | Long bullish body | Shows buyers in charge |
| Candle 2 | Small body, either colour | Shows the push stalling |
| Star position | At or above candle 1 close | Marks the top |
| Candle 3 | Bearish, long body | Shows sellers arriving |
| Candle 3 close | Below candle 1 midpoint | Confirms the turn |
New to bodies and wicks? The guide to reading candlestick charts covers them from zero.
Evening star meaning: the three-session story
Each candle is one session of a tug-of-war. Read in order, they tell a short story about buyers running out of fuel.
- Candle 1. Buyers push hard and close near the high. Everyone long feels great.
- Candle 2. Price opens up again, then goes nowhere. Buyers can’t extend the move, and sellers don’t take over yet.
- Candle 3. Sellers show up with size. Price drops through the star and wipes out much of candle 1.
The star is the key. A small body at the top means the session that should have continued the rally produced a stalemate instead.
| It does say | It does not say |
|---|---|
| The rally stalled | The uptrend is over |
| Sellers took back ground | How far price will fall |
| Longs (open buys) should tighten up | Short (sell) at any price |
| Watch the next level down | The next candle is red |
Rule of thumb: the star asks “can buyers keep going?”, and candle 3 is the answer.
Evening star variants: doji star, abandoned baby and Forex versions
The textbook shape is one of a family. The middle candle and the gaps decide the variant, and the variant changes how much weight you give it.
| Variant | Middle candle | Gaps | Weight |
|---|---|---|---|
| Evening star | Small body | Often small | Standard |
| Evening doji star | Doji | Often small | Stronger |
| Bearish abandoned baby | Doji | Both sides | Strongest, rare |
| Forex evening star | Small body | None | Standard |
What each variant means in plain words:
- Evening doji star. The middle candle is a doji (open and close almost equal). That is pure indecision at the top, so many traders rate it a notch stronger. The doji candlestick guide covers the doji types.
- Bearish abandoned baby. The doji floats on its own, with a gap up before it and a gap down after it. It shows up mostly on stock charts (and CME Bitcoin futures).
- Forex evening star. Spot Forex trades around the clock, so true gaps between candles almost never happen. The star just sits at the top, its body level with or slightly above candle 1’s close.
- Bitcoin. Crypto never closes either, so treat it like Forex: judge the star by its small body and position, not by a gap.
Rule of thumb: on Forex and Bitcoin, stop looking for gaps. Body sizes and the candle 3 close carry the signal.
Evening star vs morning star, and other bearish cousins
The evening star has a mirror image and several cousins that warn at the top. Mixing them up is one of the most common beginner errors.
| Pattern | Candles | Where it prints | Read |
|---|---|---|---|
| Evening star | 3 | After a rally | Bearish reversal |
| Morning star | 3 | After a decline | Bullish reversal |
| Shooting star | 1 | After a rally | Bearish warning |
| Bearish engulfing | 2 | After a rally | Bearish reversal |
| Hanging man | 1 | After a rally | Bearish warning |
The pairs worth separating:
- Evening star vs morning star. Same three-step logic, flipped. The morning star is a long red candle, a small star below it, then a green candle closing above the first candle’s midpoint, at the bottom of a decline.
- Evening star vs shooting star. The shooting star is a single candle with a long upper wick. An evening star often has a shooting star as its middle candle, which makes the top louder.
- Evening star vs bearish engulfing. Engulfing is two candles: a red body that swallows the prior green body. An evening star is slower, with a pause candle in between. Both say “sellers took over”, one in two sessions, one in three.
- Evening star vs hanging man. A hanging man is one warning candle. When the session after it stalls and the third falls hard, the sequence can grow into an evening star.
The bearish candlestick patterns guide lines up the whole bearish family side by side.
Method 1: the confirmed evening star (the textbook read)
This is the read the anatomy chart shows. You wait for all three candles to close and act only if candle 3 closes below candle 1’s midpoint.
A few shorthand terms first, because the rules and tables use them:
| Term | Meaning |
|---|---|
| D1 / H4 / H1 | One candle per day / 4 hours / hour |
| W1 / M15 | One candle per week / 15 minutes |
| Long / short | A buy trade / a sell trade |
| Pip | Smallest usual FX move, 0.0001 |
| Micro lot | 0.01 lot, about $0.10 per EUR/USD pip |
| Sell-stop | Order that sells if price drops to it |
The rules, written for the daily or 4-hour chart:
- Timeframe: D1 or H4. Below H1, three-candle shapes appear constantly and mean little.
- Trend: at least a few higher highs and higher lows before candle 1.
- Candle 1: a long green body, clearly bigger than the candles before it.
- Candle 2: a small body at or above candle 1’s close. Its colour doesn’t matter.
- Candle 3: a red candle closing below candle 1’s midpoint. Measure it: (candle 1 open + candle 1 close) ÷ 2.
- Entry: on candle 3’s close, or with a sell-stop a pip or two under candle 3’s low.
- Stop: a few pips above the highest point of the star.
- Target: the nearest support below, or twice the stop distance (a risk/reward of 1:2).
The midpoint is the strictness dial. Here is how traders grade candle 3:
| Candle 3 closes | Strength | Trade-off |
|---|---|---|
| Inside candle 1, above midpoint | Weak | Many false turns |
| Below candle 1 midpoint | Standard | The textbook line |
| Below candle 1 open | Strong | Later entry, wider stop |
| Next candle also lower | Strongest | Much of the move gone |
| Role | How you use it | Best read |
|---|---|---|
| Entry trigger | Sell candle 3's close | H4 EUR/USD, D1 gold |
| Stop anchor | Stop above the star | Any timeframe |
| Skip filter | Above midpoint, no trade | All markets |
| Exit cue | Cover at next support | D1, H4 |
Where Method 1 struggles:
- Strong trends. A confirmed evening star in a powerful rally often turns into a one-day dip.
- Tiny rallies. Three small candles up is not much of a trend to end.
- Wide stars. A star with long wicks pushes your stop far away and wrecks the reward-to-risk.
Method 2: the evening star at the top of a stretched rally
The pattern works best when the rally before it is fast and the market has run out of room. Here is a clean case on a 4-hour EUR/USD chart.
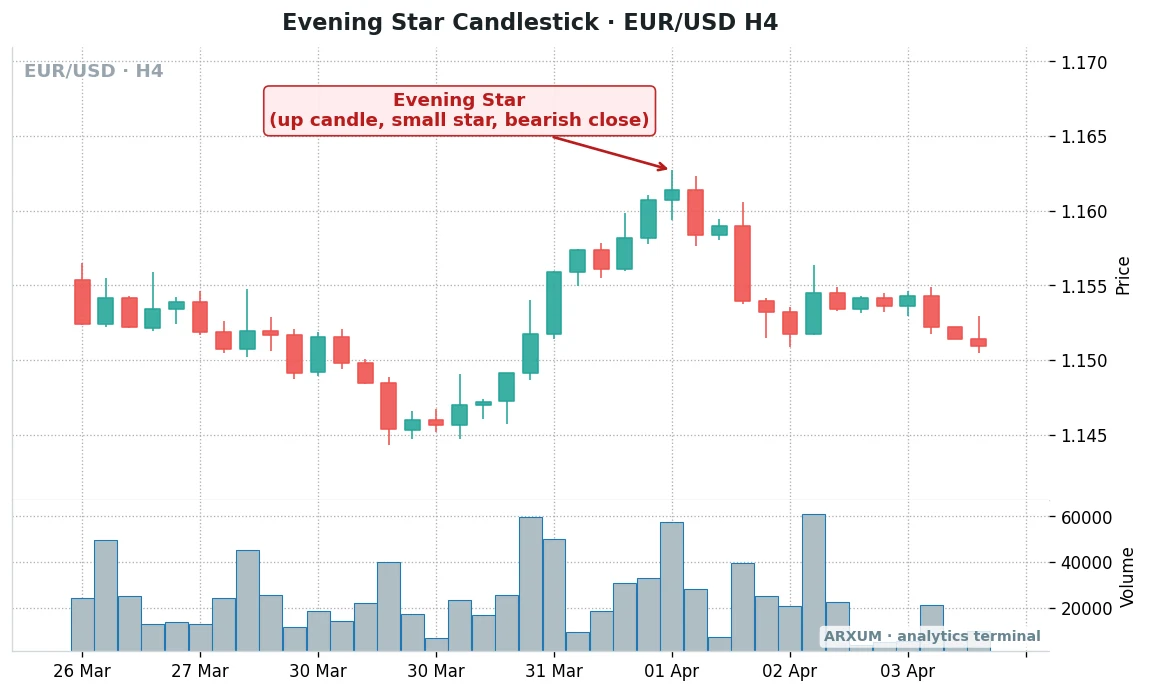
Reading the sequence:
- The stretch. The pair bounced about 150 pips in roughly two days, mostly in big green candles. A move that steep tends to run out of buyers fast.
- Candle 1. A solid green candle pushes into the 1.160s.
- The star. A small body prints right at the top, near 1.161. No gap, as expected on Forex.
- Candle 3. A red candle drops back toward 1.1585, below candle 1’s midpoint. The textbook line is crossed.
- Follow-through. After a brief pause, a larger red candle takes price to the 1.154 area, and it keeps drifting lower.
What made this one clean is the context, not the shape alone. A sharp, extended rally on a slow major pair is the kind of top an evening star describes well.
How to tell a rally is stretched before the star prints:
- Candle size. The last few candles are much larger than the average of the prior week.
- Distance from a moving average. Price sits far above a 20-period average, the short-term mean.
- RSI above 70. RSI (Relative Strength Index) is a 0 to 100 momentum gauge, and above 70 reads as stretched. The RSI guide covers the settings.
- A level overhead. A prior swing high or a round number such as 1.1600. The support and resistance guide shows how to mark them.
| Instrument | Best timeframe | Stretch sign |
|---|---|---|
| EUR/USD | H4, D1 | Round-number test |
| GBP/USD | H4 | Fast spike, wide candles |
| Gold (XAU/USD) | D1 | Prior swing high |
| Silver (XAG/USD) | D1 | Vertical run |
| Oil (WTI) | D1 | Range top |
Rule of thumb: an evening star after a slow grind is weak. One after a vertical sprint into a level deserves your attention.
Method 3: the evening star as an exit cue on Bitcoin
For many traders this is the most practical read. If you already hold a long, the pattern tells you to protect it, not necessarily to flip short.
The daily Bitcoin chart shows why that distinction matters.
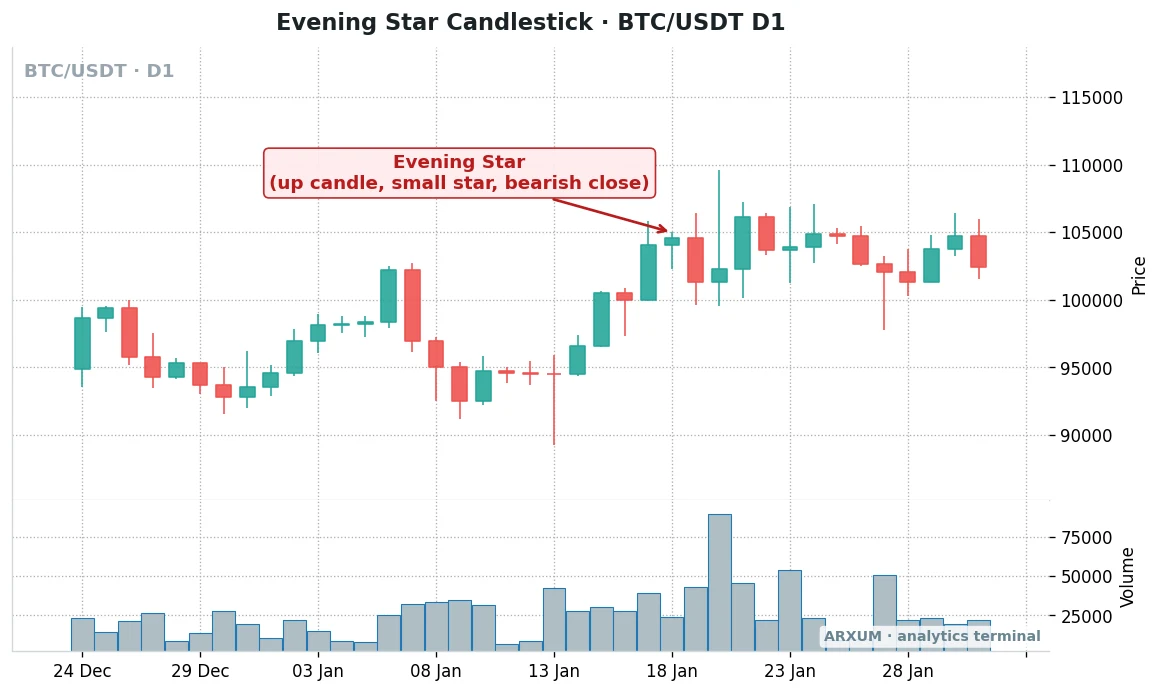
What happened after the signal:
- The pattern was valid. A strong push candle, a tiny star at the high, and a red third candle closing below the push candle’s midpoint.
- There was no crash. Bitcoin went sideways for about two weeks instead of reversing.
- The short had a rough ride. A stop just above the star would have been hit by the spike toward 110,000 a couple of days later.
- The long holder did fine. Taking part of the profit near 104,000 and tightening the stop kept most of the rally banked, through all the chop.
That is the honest lesson. In a strong crypto trend the evening star often marks a pause, not a top, so its most reliable job is managing a long you already hold.
| Situation | Action | Best read |
|---|---|---|
| Long in good profit | Bank part of it | D1 BTC, D1 gold |
| Long near target | Close the trade | Any timeframe |
| Candle 3 below midpoint | Stop under candle 3 low | H4, D1 |
| Candle 3 weak | Hold, stop tightened | All markets |
Why this role suits beginners:
- It doesn’t ask you to fight a strong trend.
- Candle 3’s low gives an obvious place for a tighter stop.
- If the warning fails, you are still long.
- If it works, you kept more of the move than a fixed stop would have.
The trailing stop guide covers how to move a stop up as a trend runs.
The confirmation menu: what to stack on the evening star pattern
Three candles carry more information than one, but the evening star pattern still benefits from a second gauge. Below is the usual menu.
| Gauge | What it adds | Where it fits |
|---|---|---|
| Midpoint close | Basic confirmation | Every market |
| Resistance level | A reason to stall | Forex, gold |
| RSI above 70 (stretched) | Tired momentum | D1, H4 |
| Bearish RSI divergence | Fading momentum | D1 |
| 200-EMA side (long-run average) | Trend context | All timeframes |
| Volume on candle 3 | Real selling | BTC only |
| Higher-timeframe level | Bigger-picture ceiling | H4 setups |
Each gauge in plain words:
- RSI divergence is price making a higher high while RSI makes a lower high. It is rare, but next to an evening star it makes the warning louder. The RSI divergence guide shows what a real one looks like.
- The 200-EMA is a moving average of the last 200 candles that weights recent prices more. Price far above it means the main trend is up, so the pattern there is more likely an exit cue than a reversal.
- Volume only means something on crypto exchanges. On gold and spot Forex the volume bar is tick volume, a count of price updates.
- A higher-timeframe level means a daily or weekly high sitting just above the H4 pattern. It turns a small top into one with a reason.
On Arxum’s tested strategy pages, running this whole menu against a pattern and keeping only the gauge that actually improves it is what we call the filter sweep. This explainer just lays the menu out.
Indicator recipe:
- TradingView: open the chart, click Indicators, then add “Relative Strength Index” (length 14) and “Moving Average Exponential” (length 200). Volume shows by default.
- MT4/MT5: Insert → Indicators → Oscillators → Relative Strength Index (14), then Insert → Indicators → Trend → Moving Average (period 200, method Exponential).
- TradingView also has a built-in “Evening Star - Bearish” candlestick pattern indicator. It flags shapes, not context, so check every flag against the checklist above.
Rule of thumb: one extra gauge is enough. Stack four and you’ll almost never get a signal.
The evening star candlestick across markets and timeframes
The three-candle logic is the same everywhere. What changes is how often the pattern prints and how much noise sits around it.
| Market | Reads cleanest on | Quirk to know |
|---|---|---|
| EUR/USD | H4, D1 | No gaps, respects levels |
| GBP/USD | H4 | Spiky, more fakes |
| USD/JPY | D1 | Intervention spikes |
| Gold (XAU/USD) | D1 | News wicks, wide stars |
| Silver (XAG/USD) | D1 | Sharp, fast reversals |
| Bitcoin (BTC) | D1 | Trend often overrides it |
| Oil (WTI) | D1 | Inventory-day candles |
| Timeframe | Signal quality | Best use |
|---|---|---|
| W1 | High, very rare | Big-picture top warning |
| D1 | Best balance | Methods 1 and 3 |
| H4 | Good | Method 2 on Forex |
| H1 | Noisy | Time a D1 or H4 setup |
| M15 and lower | Mostly noise | Skip |
Two things change the read on any market:
- News candles. A data release can print a huge candle 1 or candle 3 that is reaction, not a shift in control. Check the calendar.
- Forex daily close. The daily candle’s shape depends on your broker’s close time. A New York 5pm close gives the cleanest daily candles.
Which method to use when
Each read fits a different trader and a different market state. Use this table to pick.
| If you are... | Use | Timeframe |
|---|---|---|
| Flat, rally looks tired | Method 1 | D1, H4 |
| Flat, rally is vertical | Method 2 | H4 |
| Already long | Method 3 | D1 |
| In a strong trend | Method 3 only | Any |
| In a sideways range | Method 1 at the top | H4 |
How to place an evening star trade, step by step
If you want to use Method 1 or 2 in your own trading, here is the full sequence. The prices below are example arithmetic, not a result.
- Mark resistance levels on the daily chart before the session.
- Wait for all three candles to close. A star mid-session can still turn into a big green candle.
- Measure candle 1’s midpoint and check that candle 3 closed below it.
- Place a sell-stop a pip or two under candle 3’s low.
- Set the stop-loss a few pips above the star’s high.
- Set the take-profit at twice the stop distance, or at the nearest support if that is closer.
- Size the position so the stop costs 2% of the account.
A worked example on a 4-hour EUR/USD chart, with a $1,000 account:
| Step | Value |
|---|---|
| Star high | 1.1622 |
| Candle 3 low | 1.1583 |
| Stop-loss (5 pips above star) | 1.1627 |
| Sell-stop entry (2 pips below) | 1.1581 |
| Stop distance | 46 pips |
| Risk budget (2%) | $20 |
| Take-profit (1:2) | 1.1489 |
The division, line by line:
- One micro lot (0.01) on EUR/USD is worth about $0.10 per pip.
- Risk per micro lot: 46 pips × $0.10 = $4.60.
- Lots you can hold: $20 ÷ $4.60 = 4.3, rounded down to 4 micro lots (0.04).
- Real risk at 0.04: 46 × $0.40 = $18.40, inside the 2% budget.
- Target: 92 pips away (2 × 46), worth about $36.80 if it fills.
- On a $500 account: $10 ÷ $4.60 = 2.2, so 2 micro lots, risking $9.20.
In the platform, the ticket looks like this: order type Sell Stop, volume 0.04, price 1.1581, stop loss 1.1627, take profit 1.1489. If candle 4 rallies back above the star before your entry fills, cancel the order.
On leverage: 0.04 lots is 4,000 euros, about $4,640 of exposure, roughly 1:4.6 on a $1,000 account.
Your broker’s 1:100 or higher only sets the deposit (margin) needed to open that size. The 2% stop already caps the risk.
Gold and Bitcoin need a check before you trade them on a small account:
- Gold. A daily star often needs a $25 to $40 stop. The smallest gold lot (0.01) is one ounce, so $1 of risk per $1 move. A $30 stop risks $30, which is 3% of $1,000. Over the rule, so use the H4 chart where stars are tighter, or stick to EUR/USD.
- Bitcoin. Stops on a daily star run into the thousands of dollars. Check your broker’s smallest BTC size and work the same division before you click.
The position sizing guide walks through the same calculation for other pairs and metals.
Risk and discipline with a three-candle top
An evening star is a fair signal with a known weak spot: strong trends run through it. How you handle the misses decides whether it is worth using.
- Expect failed tops. The Bitcoin chart is the normal case in a hot trend, not a rare one.
- Keep risk at 2% per trade. A run of failed stars at that size stays a dent.
- Pause after 3 to 6 losses in a row. A streak like that usually means the market is trending too hard for reversal reads. Switch to Method 3 until it calms.
- Don’t short the next star harder after a loss. Revenge sizing turns one bad week into a bad month.
- Don’t chase a candle 3 that already fell far. Much of the move may be done, and your stop is now huge.
- Only trade money you can afford to lose.
Common mistakes with the evening star
- Trading it with no rally first. Three candles in the middle of a range are not a top.
- Accepting a weak candle 3. A red candle that stays above candle 1’s midpoint is a pause, not a reversal.
- Waiting for gaps on Forex. They almost never come. Judge body size and position instead.
- Acting before candle 3 closes. A red candle at 2pm can be green by the close.
- Ignoring a wide star. Long wicks on the star push the stop far away and break the 1:2 math.
- Shorting far above the 200-EMA. Deep in a strong uptrend, use the pattern to protect longs.
- Trusting tick volume on gold or Forex. It counts updates, not money.
- Calling a morning star an evening star. Check the direction of the trend before naming it.
What works: the short version
- Midpoint first. Act only when candle 3 closes below candle 1’s midpoint.
- Context second. The best evening stars end a stretched rally into a level, like the EUR/USD chart.
- Exit cue in strong trends. On Bitcoin or gold in a hot run, use it to protect a long.
- Fixed risk. Stop above the star, sized so the stop costs 2%.
The bullish mirror of everything above lives in the morning star pattern guide, and the wider family is in the candlestick patterns guide.
Glossary
- Real body: the thick part of a candle, between the open and the close.
- Wick (shadow): the thin line showing how far price went beyond the body.
- Star: a small-bodied candle at the edge of a move, showing a stall.
- Doji: a candle whose open and close are almost equal.
- Midpoint: halfway between candle 1’s open and close.
- Gap: a jump between one candle’s close and the next one’s open.
- Resistance: a price zone where rallies have stalled before.
- Sell-stop: a pending order that sells only if price falls to your level.
- Micro lot: 0.01 of a standard lot; about $0.10 per EUR/USD pip.
- Tick volume: a count of price updates, shown on gold and Forex.
- Risk/reward 1:2: you risk one unit to make two.
FAQ
What is an evening star candlestick, in plain terms?
An evening star is a three-candle pattern at the top of a rally. A strong green candle is followed by a small-bodied candle that stalls, then a red candle that closes deep into the first one. Together they show buyers running out of steam and sellers stepping in. It is a warning that the uptrend may be turning.
Is the evening star bullish or bearish?
Bearish. It prints after a rally and warns of a possible top.
What is the difference between an evening star and a morning star?
They are mirror images. The evening star forms at the top of a rally: a long green candle, a small star above it, then a red candle closing below the first candle's midpoint. The morning star forms at the bottom of a decline: a long red candle, a small star below it, then a green candle closing above the first candle's midpoint. Same logic, opposite direction.
How reliable is the evening star pattern?
It is one of the clearer reversal shapes, because it takes three sessions to form and shows the shift step by step. Its reliability depends on context. After a stretched rally into resistance it reads well. Inside a strong trend, as on Bitcoin during a hot run, it often marks a pause instead of a top. Treat it as strong evidence, never as a guarantee.
Does the evening star need a gap?
Not on Forex or crypto. Those markets trade almost nonstop, so gaps between candles rarely appear. Judge the star by its small body and its position at the top instead. Gaps matter more on stock charts.
What is an evening doji star?
It is an evening star whose middle candle is a doji, meaning its open and close are almost the same. That shows complete indecision at the top of the rally, so many traders give it slightly more weight than the standard version.
What timeframe is best for the evening star?
The daily chart gives the best balance on gold, Forex and Bitcoin. The 4-hour works well on major Forex pairs, especially after a sharp rally. On the 1-hour and lower, three-candle shapes appear so often that most mean little, so use them only to time a setup the daily or 4-hour already flagged.
Where do I put the stop-loss on an evening star trade?
A few pips or points above the star's highest point. If price breaks back above the star, the top has failed and the trade is wrong.
How much money do I need to trade an evening star?
On EUR/USD, a $500 to $1,000 account can trade it at 2% risk with micro lots, as long as the stop is a few dozen pips. Daily gold is harder, because stars there often need stops of $25 or more, which breaks the 2% rule at the smallest lot on a small account. Start with a major Forex pair.
What do the terms on the evening star charts mean?
Candle 1 is the long green push, candle 2 is the small star, and candle 3 is the red reversal candle. The midpoint is halfway between candle 1's open and close, shown as a dashed line on the anatomy chart. Tick volume, under the EUR/USD chart, counts price updates rather than money traded, while the Bitcoin chart shows real exchange volume.
Real-time trade setups with entry, stop loss and take profit. Daily market analysis. No subscription, no complicated theory.
🌍 Our recommended brokers


Reader Reviews
Be the first to review this — tell other traders what actually helped, or where it fell short.
Leave a Review

Quant Researcher & Systems Builder
Quantitative researcher who builds the automated systems behind Arxum strategy testing. Works in Python and Pine Script, using AI alongside classic backtesting to validate strategies on years of real data.