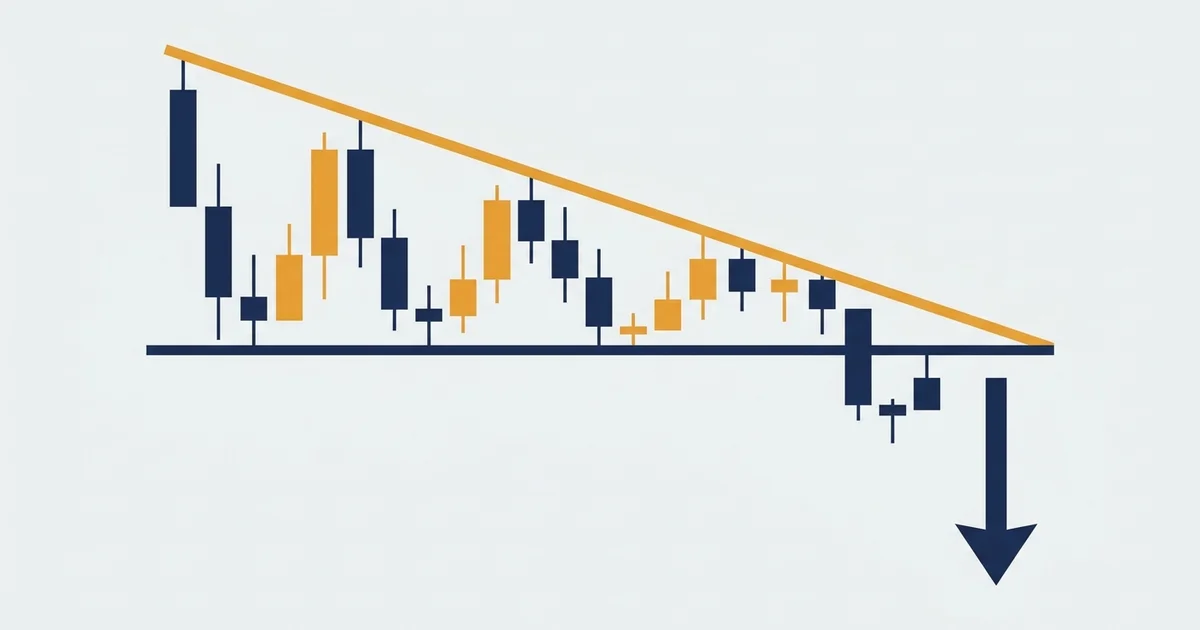

What the descending triangle pattern looks like
One line is flat, the other slopes down toward it. Here is the shape on a daily chart of spot gold (XAU/USD), right after a sharp one-day drop.
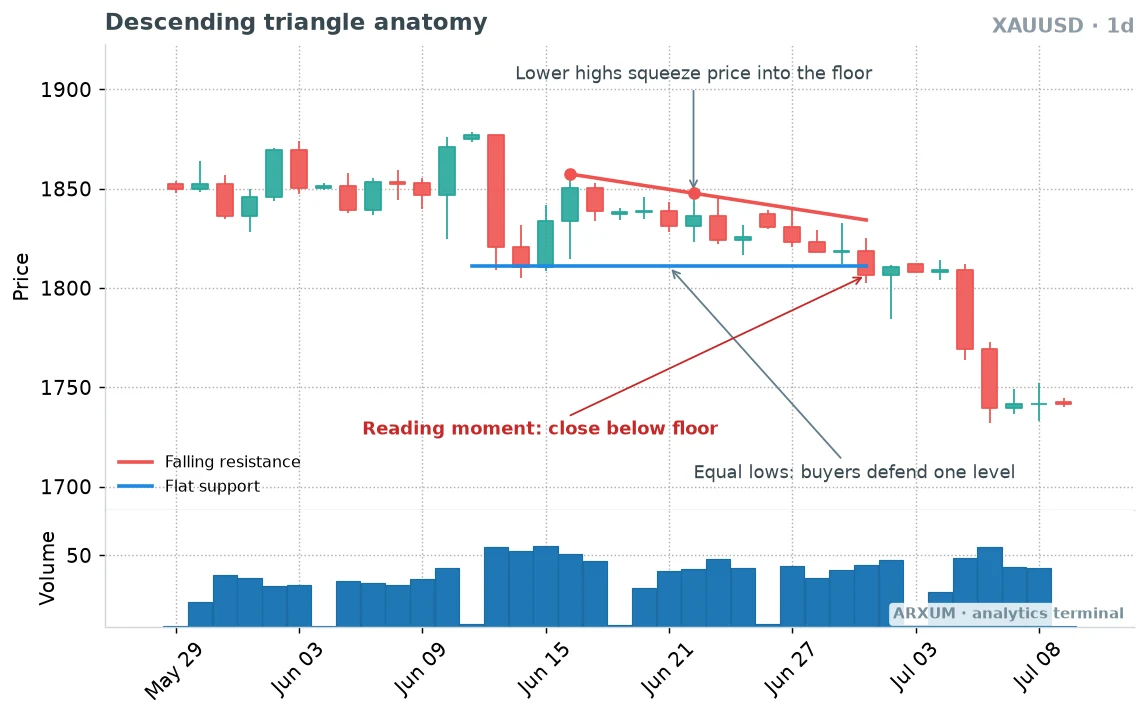
Every label on that chart has one job. Here is what each one tells you.
- Flat support (blue): the floor. Gold dipped to roughly 1,811 again and again, and buyers caught it each time.
- “Equal lows: buyers defend one level”: those dips line up flat because one group of buyers keeps bidding at that price.
- Falling resistance (red): the ceiling, drawn through the swing highs. The first high sat near 1,858, a later one near 1,848.
- “Lower highs squeeze price into the floor”: every bounce runs out of steam sooner. Sellers are getting more eager, and the room between the lines shrinks.
- “Reading moment: close below floor”: the first daily candle that closes under the blue line. Until then, the floor is still holding.
- XAUUSD · 1d: the instrument (gold priced in US dollars) and the timeframe, one candle per day.
Now look at what came after the reading moment. Gold sat just under the old floor for three sessions, then dropped about 70 dollars in two days, to near 1,740.
That pause under the line matters. It is the retest, and it is where the second method below lives.
Parts of the pattern at a glance
| Part | What it is | What to check |
| Floor | Flat support line | 2+ lows at one level |
| Ceiling | Falling resistance line | 2+ lower highs |
| Squeeze | The narrowing gap | Weaker, shorter bounces |
| Breakdown | Close below floor | A body under, not a wick |
| Failure | Close back above floor | Or a close over the ceiling |
Drawing it without fooling yourself
- The floor goes through the lows that cluster at one price. Small gaps between them are fine; a staircase of falling lows is a different pattern.
- The ceiling goes through swing highs, the real turning points of each bounce. Do not fit it through the middle of the candles.
- Two touches per line is the minimum. Three touches on the floor make the read much cleaner.
- Pick wicks or bodies and use the same choice on both lines.
- If the ceiling is flat too, you have a range. If the floor slopes up, it is a symmetrical triangle.
- If both lines fall and close in on each other, that is a falling wedge, which usually breaks the other way.
Is the descending triangle bullish or bearish?
Mostly bearish, and especially so inside a downtrend. The read changes with where the shape forms, so check the backdrop before the lines.
| Context | Usual read | Trust |
| Inside a downtrend | Continuation down | Highest |
| After a sharp drop | Pause, then lower | High |
| Top of a long rally | Possible top | Medium |
| Inside an uptrend | Often breaks up | Low |
| Long base after a decline | Can be a bottom | Low to medium |
Why it sometimes turns bullish:
- A flat floor that holds for weeks after a big decline can be buyers quietly building a position. Some of these bases break up, not down.
- In a strong uptrend, the falling ceiling is often just a pullback. Price closes above it and the trend resumes.
- The deciding event is the close. A daily close above the falling ceiling cancels the bearish read, whatever the textbook says.
The fastest trend check is the 200-period EMA. An EMA (exponential moving average) is an average of recent closes that gives the newest ones more weight, and price under a falling 200-EMA means the bigger trend points down.
On TradingView it is the built-in “Moving Average Exponential”, length 200. Below it, a descending triangle is in its home ground.
How it compares with its neighbours
| Pattern | Top line | Bottom line | Usual break |
| Descending triangle | Falling | Flat | Down |
| Ascending triangle | Flat | Rising | Up |
| Symmetrical triangle | Falling | Rising | With the trend |
| Falling wedge | Falling | Falling | Up |
| Bear flag | Rising | Rising, parallel | Down |
- The ascending triangle is the exact mirror: flat ceiling, rising floor, usually breaks up.
- A bear flag also continues a decline, but it drifts up in a tidy channel after a steep drop.
- In our triangle chart patterns study, the descending version was the most demanding of the three. It needs a market that is genuinely falling, and in rising years it gave little.
Three ways to trade the descending triangle
The same shape supports three distinct trades. Pick by temperament and by the timeframe you can actually watch.
Shorthand in the tables: D1 is the daily chart, H4 the 4-hour, H1 the 1-hour, M15 the 15-minute. TF means timeframe.
| Method | You act when | Fits best |
| 1. Close-below breakdown | A candle closes under | D1, gold, indices |
| 2. Retest sell | Price returns, fails | H4, GBP/USD, EUR/USD |
| 3. Wick trap and flip | The break does not hold | M15 to H1, Bitcoin |
1. Selling the close below the floor
| Role | How you use it | Best read |
| Entry trigger | Sell the close below | D1 gold, D1 GBP/USD |
| Trend read | Price under 200-EMA | D1 on any market |
| Confirming gauge | Next close stays under | D1, H4 |
| Filter | Skip in a strong uptrend | Any instrument |
| Exit cue | Close back above floor | Same TF as entry |
This is the textbook trade. You wait for a full candle to close under the flat support, then sell on or just after that close.
The gold anatomy chart shows it cleanly. The reading moment is a daily close near 1,807, a few dollars under the 1,811 floor.
Signs the breakdown is real:
- The bounces were visibly weakening: each red-line touch came lower and faded faster.
- The breakdown candle closes with its body under the line. A long lower wick that snaps back above does not count.
- The next one or two candles stay under the floor, or tap it from below and close lower again.
- The market came into the triangle already falling. On gold, a one-day drop of about 55 dollars set it up.
Signs it is not:
- Price closes under, then the next candle closes right back above the floor.
- Price hovers under the line for days with no follow-through, while the bigger trend points up.
Rule of thumb: on the daily, sell the close, never the intraday dip under the line.
The stop goes above the last lower high on the falling ceiling. On the gold chart that was around 1,840, which is far enough to survive the three quiet sessions that followed the break.
2. Selling the retest of the broken floor
Patient traders skip the first close. They wait for price to rise back to the broken floor, watch it fail there, and sell that failure.
Here is the setup on a 4-hour chart of GBP/USD, where the return to the line is easy to see.
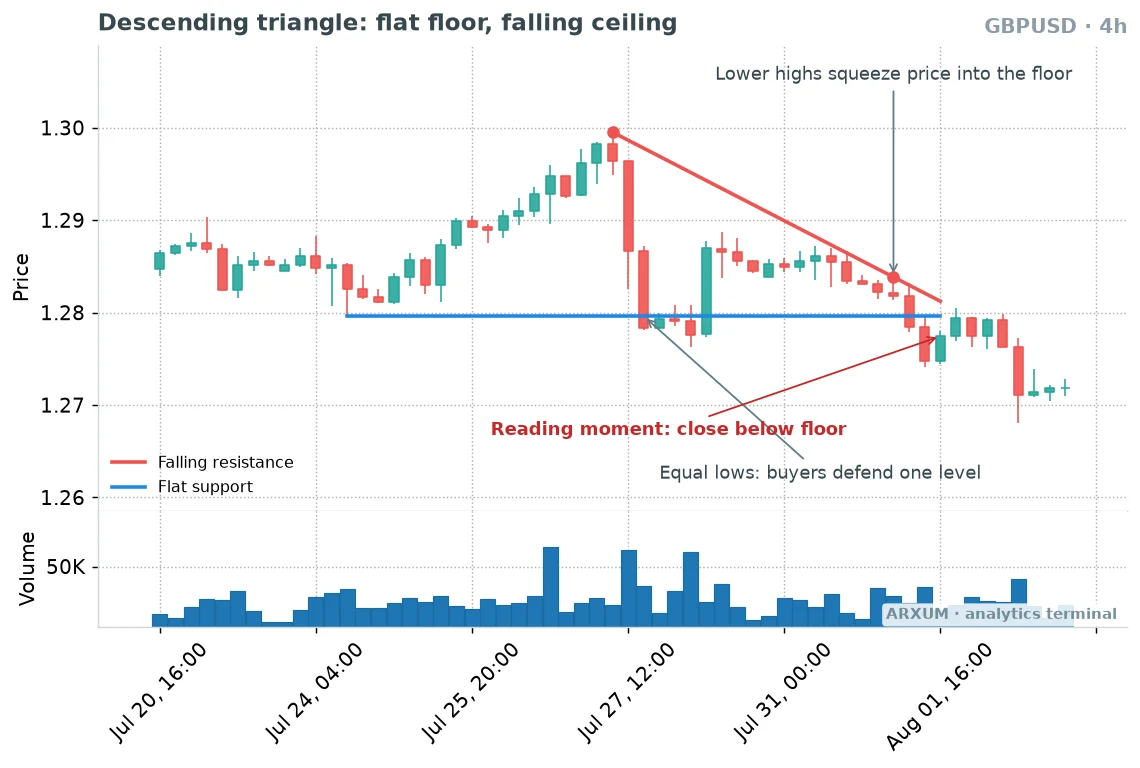
Reading the chart left to right:
- The pound rallied to about 1.2995, then one heavy 4-hour candle dropped it to the 1.280 area. That sell-off set the floor.
- Buyers held 1.2797 several times. One green candle even ran to about 1.287, but it stopped well under the falling ceiling.
- Each later bounce topped out lower, with the last marked high near 1.2838.
- A 4-hour candle then closed near 1.2785, under the floor.
- Over the next few candles price climbed back to about 1.279. The closes stayed at or just under the old floor.
- After that failed retest, the pair dropped to around 1.271.
That stall at 1.279 is the whole point of method 2. The level that caught price on the way down now blocks it on the way up, which is the classic role reversal in support and resistance.
| Role | How you use it | Best read |
| Setup alert | Close below floor | H4 GBP/USD, H4 EUR/USD |
| Entry trigger | Bearish close at the line | H4, H1 to fine-tune |
| Confirming gauge | Closes stay under | H4 |
| Filter | D1 trend is down or flat | D1 200-EMA |
| Exit cue | 4H close back above line | H4 |
What you gain and what you give up:
- The stop can sit just above the retest high, often much closer than the top of the whole triangle.
- The strongest breakdowns never come back, so you miss them. That is the trade-off for a better price.
- A wick poking above the old floor during the retest is normal. Judge the failure by where the 4-hour candle closes.
- GBP/USD swings wider than EUR/USD, so give the stop a few extra pips on GBP/USD. A pip is the standard smallest price step, 0.0001 on the pound and the euro. On the euro, the same retest tends to be tighter and slower.
If the retest never comes, there is no trade. Selling late, far below the floor, turns a good retest entry into a bad chase.
3. The wick trap and the bullish flip
This method is about not getting caught. It reads the moments when the floor looks broken but is not, and the rarer moment when the whole pattern turns against the sellers.
Here is a 15-minute chart of Bitcoin (BTC/USDT) that shows both a fake break and a real one inside the same triangle.
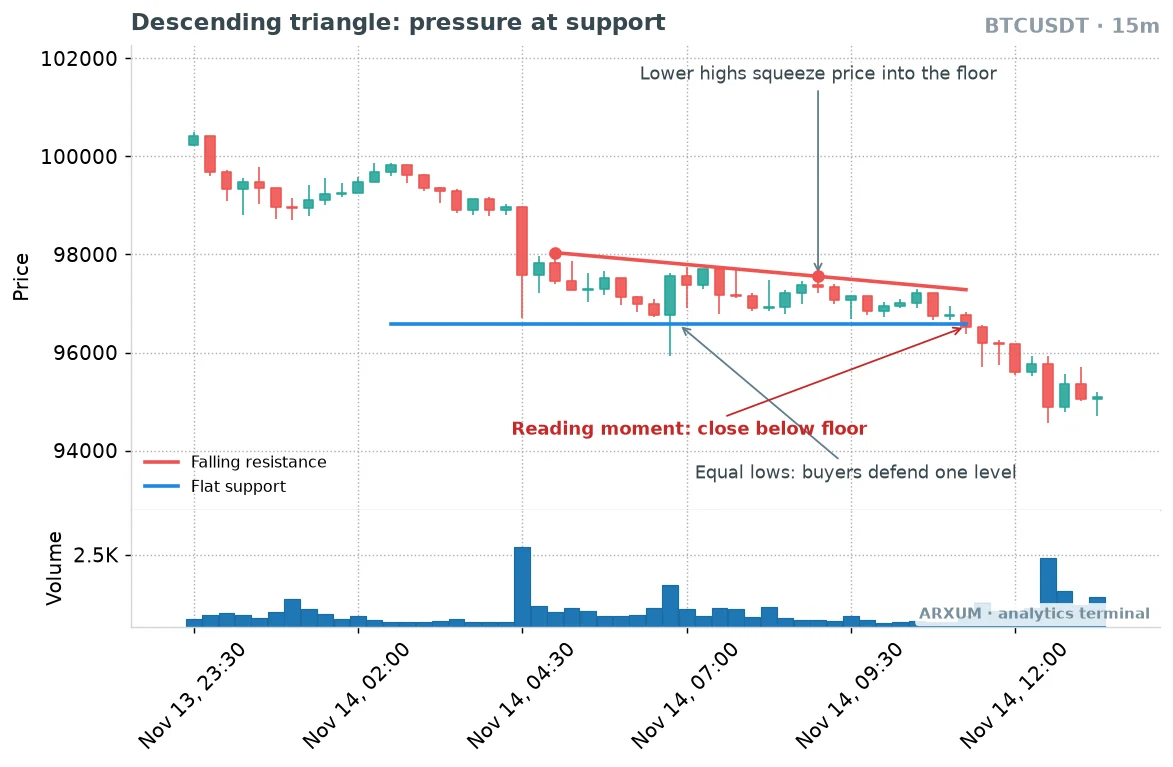
What the chart shows:
- After a slide from above 100,000, Bitcoin found a floor near 96,600 and started printing lower highs.
- Early in the triangle, one candle stabbed down to about 95,950. Its body closed back above the floor, so the floor was still intact.
- Anyone who sold that wick got squeezed: price ran up to the ceiling within the next hour.
- Hours later, a candle closed under the floor near 96,450. This time the next candles kept closing lower.
- Price then fell to around 94,600, and exchange volume jumped on that drop.
So one chart holds the lesson twice. A wick through the floor is noise; a close through it, held by the next candles, is the signal.
The flip is the other half. If a descending triangle closes above its falling ceiling instead, the sellers have lost the argument.
Shorts (sell trades that profit when price falls) placed under the floor tend to get covered, meaning bought back to close, in a hurry.
| Role | How you use it | Best read |
| Trap warning | Wick under, body above | M15 to H1 Bitcoin |
| Real signal | Close under, next holds | Entry TF |
| Short exit | Close back above floor | Entry TF |
| Bullish flip | Close over the ceiling | H1, H4 |
| Context | Higher TF trend | H4, D1 |
Using it without overtrading:
- Never sell the first wick under the floor. Wait for a candle body to close under it.
- If you are short and price closes back above the floor, cut the trade. The idea has failed, even if the stop has not been hit yet.
- A close over the falling ceiling is the cleaner reversal signal. Some traders buy it, with a stop under the floor.
- Bitcoin trades all week and reports real volume, so a breakdown on rising volume carries more weight there than on gold or Forex.
- On 15-minute charts these traps are constant. Use the low timeframe to manage a trade, not to find every setup.
Rule of thumb: a floor is broken when a body closes under it and the next candle agrees.
Confirmations that sort real breakdowns from fake ones
None of these checks makes the pattern certain. Each one simply removes a type of weak setup.
| Check | What to look for | Works on |
| Close, not wick | Body under the floor | All markets |
| Trend | Price under 200-EMA | All markets |
| Weakening bounces | Each high lower, shorter | All markets |
| Real volume | Rise on the drop | Bitcoin, crypto |
| Higher TF | D1 or H4 agrees | Intraday setups |
| Session | Break in active hours | Forex, gold |
Our full triangle research runs the filter sweep, the whole menu of confirmations tested against the pattern. This guide simply lists what each check does and where it can be read.
Notes on each check:
- Weakening bounces are visible by eye. If each rally off the floor is smaller than the last, sellers are taking control.
- For a number, use ATR (average true range), the average size of recent candles. On TradingView, add the built-in “Average True Range”, length 14; a falling ATR inside the triangle confirms the squeeze.
- Tick volume on gold and Forex counts price changes, not money traded. Treat it as a rough activity gauge, never as proof of a real breakdown.
- Sessions matter on GBP/USD, EUR/USD and gold. A break during London (from about 07:00 UTC) or New York (about 12:00-13:00 UTC) means more than one in the quiet Asian hours.
- A higher-timeframe check costs nothing. A 15-minute breakdown that runs against a rising daily trend is the first one to fail.
The descending triangle across markets and timeframes
The geometry never changes. What changes is how often the shape appears, how noisy it is, and which check deserves your trust.
| Market | Character | Best TF | Key check |
| Gold (XAU/USD) | Long rising stretches | D1 | Trend first |
| GBP/USD | Wide swings | H4, D1 | Retest close |
| EUR/USD | Slow, orderly | H4 | Retest close |
| Bitcoin | Fast, real volume | H4, H1 | Volume on drop |
| Silver (XAG/USD) | Jumpy, deep wicks | D1 | Wider stop |
| WTI oil | Report-day spikes | D1 | Avoid data days |
Market by market:
- Gold: the metal has spent long stretches climbing, so a bearish triangle there often fights the tide. Take it only when price is already under a falling 200-EMA, as in the anatomy chart.
- GBP/USD: the pound breaks sharply and then often retests, which makes it a natural home for method 2.
- EUR/USD: the most liquid pair moves in smaller steps. Its triangles take longer to build, so the 4-hour is the sweet spot.
- Bitcoin: real exchange volume and weekend trading make it the best place to read volume. It also prints more wick traps than any other market here.
- Silver and oil: both form clean triangles, but data releases and inventory reports can jump a stop. Stick to the daily and trade smaller.
| Timeframe | How often | Noise | Best job |
| D1 | Rare | Low | Main trades |
| H4 | Regular | Moderate | Retest sells |
| H1 | Frequent | High | Timing entries |
| M15 | Constant | Very high | Exits, trap reads |
- A daily triangle that took weeks to form reflects real positioning. A 15-minute one often reflects a slow lunch hour.
- The cleanest workflow: find the pattern on the daily or 4-hour, then drop to the 1-hour only to time the entry.
How to calculate the descending triangle target
The usual target is the measured move. Take the triangle’s height at its widest point and subtract it from the floor.
On GBP/USD the height is counted in pips. A pip is the standard smallest price step, 0.0001 on the pound and the euro, so 1.2995 down to 1.2797 is 198 pips.
| Chart | First high | Floor | Height | Target |
| Gold D1 | ~1,858 | ~1,811 | ~47 | ~1,764 |
| GBP/USD H4 | ~1.2995 | ~1.2797 | ~198 pips | ~1.2600 |
| Bitcoin M15 | ~98,050 | ~96,600 | ~1,450 | ~95,150 |
Each row works the same way: first high minus floor equals the height, and floor minus height equals the target. The prices are read off the charts, so treat them as close, not exact.
- Gold and Bitcoin both traded through their targets on these charts. GBP/USD reached about 1.271 within the window shown, well short of 1.2600.
- That is normal. The measured move is a reference point, and a nearer support level often comes first.
- Many traders close part of the short halfway to target and move the stop down to the entry.
- Set the target against your stop before you click. That comparison is your risk/reward ratio, written 1:X: the 1 is what you risk, the X is how many times that risk the target offers.
How to trade the descending triangle, step by step
The routine below covers method 1 and method 2. On Forex and CFDs (contracts for difference, which track a price without you owning the asset) a short is just a sell order, with no borrowing involved.
- Spot the shape. Two or more equal lows, two or more lower highs, on the daily or 4-hour.
- Check the trend. Price under the 200-EMA on the daily is the green light; well above it, pass or wait for the flip.
- Draw the lines. A horizontal line on the floor, a trendline through the swing highs.
- Choose the method. Sell the close below (method 1) or wait for the failed retest (method 2).
- Set the stop. Above the last lower high for method 1, above the retest high for method 2.
- Set the target. The measured move, or a nearer support if one sits clearly in the way.
- Size it. Risk 2% of the account and work the lot size from the stop distance.
- Place the order. A sell-stop (a pending sell that fills only if price drops to your level) a few pips under the floor triggers only on the break. For the retest, use a sell-limit (a pending sell that fills only if price rises to your level) at the old floor.
- Manage it. A close back above the floor is your warning; a close above the falling ceiling ends the idea.
Where to click
- TradingView: search the ticker (XAUUSD, GBPUSD, BTCUSD). The “Horizontal Line” tool draws the floor, the “Trend Line” tool draws the ceiling. Use the Indicators button to add “Moving Average Exponential” (length 200) and “Average True Range” (length 14).
- MT4/MT5: Insert → Lines (MT4) or Insert → Objects → Lines (MT5) for both lines. Then Insert → Indicators → Trend → Moving Average (Exponential, period 200), and Insert → Indicators → Oscillators → Average True Range (period 14).
- The free TradingView plan is enough for everything this pattern needs.
A worked sizing example on GBP/USD
This turns the 2% rule into a real retest sell on the 4-hour GBP/USD chart. The prices come from the chart; the $1,000 account is illustrative.
One choice to note: this example enters on the retest but uses the wider method-1 stop, above the last lower high. That is the cautious version for a pair that swings as wide as GBP/USD.
The tighter method-2 stop, just above the retest high near 1.2800-1.2805, would be about 15-20 pips; the last bullet below shows what that does to the lot count.
| Step | Calculation | Result |
| Risk budget | $1,000 × 2% | $20 |
| Entry | Sell-limit at old floor | ~1.2790 |
| Stop | Above last lower high (wider, method-1 stop) | ~1.2840 |
| Stop distance | 1.2840 − 1.2790 | 50 pips |
| Value per pip | $20 ÷ 50 pips | $0.40 per pip |
| Lot size | $0.40 ÷ $0.10 per micro lot | 4 micro lots (0.04) |
- A micro lot (0.01) on GBP/USD is worth about $0.10 per pip. Four of them put $20 at risk if the stop is hit.
- Four micro lots control about £4,000, roughly $5,100, so around 5:1 effective leverage on $1,000. A broker’s 1:100 leverage is just margin room to open that size; the stop already caps the risk at 2%.
- The measured target near 1.2600 sits about 190 pips below entry, roughly 1:3.8. A nearer target at 1.2710, where this swing actually stalled, is 80 pips, about 1:1.6.
- On a $500 account, 2% is $10, which fits 2 micro lots on the same 50-pip stop.
- With the tighter method-2 stop just above the retest high, the same $20 buys more micro lots. The position sizing guide covers how a tighter stop changes the lot count for the same dollar risk.
Why the gold example does not fit a small account
The gold daily breakdown is the cleanest chart in this article, but it is the hardest to size small. The numbers show why.
| Step | Calculation | Result |
| Entry | Close below floor | ~1,807 |
| Stop | Above last lower high | ~1,840 |
| Stop distance | 1,840 − 1,807 | $33 per ounce |
| Size for $20 | $20 ÷ $33 | 0.6 oz |
| Smallest lot | 1 micro lot (0.01) | 1 oz |
| Real risk | 1 oz × $33 | $33, 3.3% |
- One standard gold lot is 100 ounces, so a micro lot is 1 ounce, and each dollar gold moves is a dollar on your position.
- The 2% budget asks for 0.6 ounces, but the platform’s minimum is 1 ounce. The trade risks 3.3% instead.
- On a $500 account that same micro lot is 6.6% of the balance. Skip it, or take gold breakdowns on the 4-hour, where stops are shorter.
Where the descending triangle goes wrong
A flat floor is the most obvious level on the chart. Plenty of traders park sell-stops just under it, and fast markets like to trigger them before reversing.
| Failure | What you see | What to do |
| Wick break | Stab under, close above | Wait for a body |
| Thin break | Closes just under | Wait one more candle |
| Wrong trend | Above a rising 200-EMA | Skip or wait |
| Reclaim | Close back above floor | Exit the short |
| Flip | Close over the ceiling | Idea dead, consider long |
| News candle | Huge bar on data | Avoid release times |
Mistakes that come from the trader:
- Seeing a floor that is not there. Three lows a fair distance apart are support, not a pattern.
- Shorting inside the triangle as an “early entry”. Before the close below, you are selling into a floor that buyers keep defending.
- Pushing the stop higher when the break wobbles. The stop marks where the idea is wrong; moving it only enlarges the loss.
- Shorting gold’s bull runs on 15-minute triangles. The bigger trend wins those arguments most of the time.
- Mixing it up with a double top. Two equal highs with a neckline under them is a different reversal shape.
Keeping the losses in proportion
- A good descending triangle still loses regularly. The edge only shows across many trades, never one.
- If three to six shorts in a row get stopped out, the market may have changed character. Pause and recheck the daily trend before the next one.
- Keep the same 2% after a big win. Doubling up on a hot streak is how one good trade gets handed back.
- After a stop-out, resist re-selling the same floor to win it back. A fresh setup will come along.
- Risk only money you can afford to lose. If live trades run clearly worse than you expected over a decent sample, step back and check the conditions; one rough week is just variance.
Which method to use when
| Your situation | Use | Timeframe |
| Clean daily triangle, downtrend | Close-below breakdown | D1 |
| Want a tighter stop | Retest sell | H4 |
| Trading GBP/USD or EUR/USD | Retest sell | H4 |
| Trading Bitcoin intraday | Wick trap read | M15 to H1 |
| Short, and price reclaims floor | Exit | Entry TF |
| Close over the ceiling | Bullish flip | H1 to D1 |
| Strong uptrend, above 200-EMA | No short | Any |
What works, in three lines:
- Trade the descending triangle pattern with a falling market: price under the 200-EMA on the daily or 4-hour.
- Sell a close under the floor, never a wick, or wait for the broken floor to fail as resistance.
- Treat a close back above the floor as your exit, and a close over the falling ceiling as the pattern turning bullish.
The same close-then-retest logic sits under most breakout trading setups, long or short. For the stop side of the trade, our stop-loss strategy guide covers placement in more depth.
Glossary
- Floor (flat support): the horizontal line through the equal lows.
- Ceiling (falling resistance): the sloping line through the lower highs.
- Lower high: a bounce that tops out below the previous one.
- Breakdown: a candle that closes below the floor.
- Retest: price rising back to the broken floor and testing it from below.
- Bullish flip: a close above the falling ceiling, which cancels the bearish read.
- Measured move: the triangle’s height subtracted from the floor to set a target.
- 200-EMA: an exponential moving average of the last 200 closes, used to read the trend.
- ATR: average true range, the average size of recent candles.
- Tick volume: a count of price changes, shown instead of traded volume on Forex and gold.
- Pip: the smallest standard price step, 0.0001 on GBP/USD and EUR/USD.
- Micro lot: 0.01 of a standard lot; about $0.10 per pip on GBP/USD, 1 ounce on gold.
FAQ
What is a descending triangle pattern, in plain terms?
It is a chart shape with a flat floor underneath and a falling ceiling on top. Buyers keep defending the same price, but each bounce tops out lower, so price gets pressed against the floor. It usually ends with a candle closing below the floor, which traders treat as a sell signal.
Is a descending triangle bullish or bearish?
Usually bearish, especially inside a downtrend. A close above the falling ceiling flips it to bullish.
How do you trade a descending triangle?
Check that price is under the 200-period EMA on the daily chart. Then sell the candle that closes below the floor, or wait for price to rise back to the broken floor and fail there. Put the stop above the last lower high, or above the retest high. Risk about 2% of the account and size the lot from the stop distance.
Can a descending triangle break upward?
Yes. In a strong uptrend, or after a long decline where buyers are quietly building a base, the floor can hold and price can close above the falling ceiling instead. That close cancels the bearish read. Some traders buy it with a stop under the floor, and anyone short should get out.
How do you calculate the descending triangle target?
Measure the height from the first high down to the floor, then subtract it from the floor. On a GBP/USD triangle with a first high at 1.2995 and a floor at 1.2797, the height is 198 pips and the target is about 1.2600. A nearer support level often comes first, so treat the target as a reference.
Where does the stop loss go on a descending triangle?
Above the last lower high on the falling ceiling. For a retest sell, just above the retest high.
What is the best timeframe for the descending triangle?
The daily and 4-hour charts. Triangles there take days to build, so the break reflects real positioning rather than a quiet hour. The 1-hour is useful to time an entry, while the 15-minute chart is best kept for managing trades and spotting wick traps.
Does volume confirm a descending triangle breakdown?
On Bitcoin and other crypto, it helps, because exchanges report real traded volume and a rise on the drop shows genuine selling. On gold and Forex your platform shows tick volume, a count of price changes, which is too rough to confirm a break. Lean on the close, the trend and the weakening bounces there.
How much money do I need to trade a descending triangle?
With micro lots, a few hundred dollars works on currency pairs. At 2% risk, a $1,000 account puts $20 on the line, which is 4 micro lots on a 50-pip GBP/USD stop, and a $500 account fits 2. Gold is harder: a daily stop of $33 per ounce means even one micro lot risks more than 2% on a small account.
What do floor, ceiling and measured move mean?
The floor is the flat support through the equal lows. The ceiling is the falling resistance through the lower highs. The measured move is the triangle's height subtracted from the floor, used as the price target.
Real-time trade setups with entry, stop loss and take profit. Daily market analysis. No subscription, no complicated theory.
🌍 Our recommended brokers


Reader Reviews
Be the first to review this — tell other traders what actually helped, or where it fell short.
Leave a Review

Forex Analyst & Senior Trader
Former FX desk trader with 8 years in institutional forex. Works in multi-timeframe analysis and order flow, turning desk experience into systematic, testable rules across forex and metals.